Looking at the available Azure Monitor data sources
The available Azure Monitor data sources is an interesting topic. Azure Monitor is a really powerful monitoring solution solely based in Azure, with a lot of capabilities. When the now retired Operations Management Suite were first presented, it was presented as a cloud agnostic solution meaning you could place your resources in any cloud besides from Azure, such as Amazon AWS or Google Cloud and still being able to monitor the resources. This is of course a real good thing (and necessary) since not everyone has or will have all their applications or servers in Azure only, there´s still a lot of on-prem servers and applications but also a lot of resources deployed in other public clouds as well.
The past and the future
Now that the Operations Management Suite has been retired and no longer exists as a licensing bundle, the replacement is called Azure Monitor which includes parts like Log Analytics, Application Insights, Azure Automation etc. But as we all know a monitoring tool is nothing without its input data, and that´s the part I´m going to elaborate on in this post.
The different data sources
Azure Monitor can receive data from, I would say almost anything nowadays because of its rich capabilities. There are a lot of data sources available and we´re talking about both metrics and logs. The capabilities for what can be imported varies based on where it´s deployed, Azure based resources such as VM´s can be configured to send metrics directly to a Log Analytics workspace, while other cloud vendor based VM´s for example can have the Log Analytics agent installed and send its logs and performance data that way.
Below is a summary of what can be collected, and where from.
Application
Performance and functionality information of the application and its code, performance traces included with application logs and user telemetry. Application Insights is needed to instrument the code to send information this way.
Operating System
Perhaps the most known feature. Send Operating System information to Log Analytics from both Windows and Unix/Linux systems. Includes performance data, such as disk usage, memory usage, network utilization and much more. Can also be used to send logs such as the Application or System logs to let you deep-dive into the systems, and to catch anomalies through simple (or complex for that matter) search queries. This functionality is available through the Log Analytics agent which send to data to up to four separate Log Analytics workspaces per agent.
Azure Resources
Keep track of a huge number of different Azure resources such as Network Security Groups for example. This way you can keep track of events raised with your Network Security Groups and much else. Activated through Diagnostics settings on the resource.
Azure Subscription
Receive information about what´s happening inside the Azure subscription. You´ll get information on service health, such as when there´s an issue with an Azure service, or lets you know when someone adds a new administrator to the subscription just to mention a few of the capabilities within this area. Available through log searches.
Azure Tenant
This is the way to view data from Azure Active Directory if you want to forward it to Azure Monitor. You can configure it to send information to Log Analytics through the diagnostic settings. Can show AuditLogs and SignInLogs.
Custom Sources
The name says it all, the sky is the limit. With this one you can send almost anything you want through the Azure Monitor HTTP Data Collector API. Information that is collected this way will be searchable as new logs in Azure Monitor, “YourAppName_CL” for example. Find out more about how to send custom source data to Azure Monitor here.
Other services
Some other services in Azure stores their data in Log Analytics and allows the data to be explored through Azure Monitor. Services that store their data this way includes Azure Security Center and Azure Sentinel.
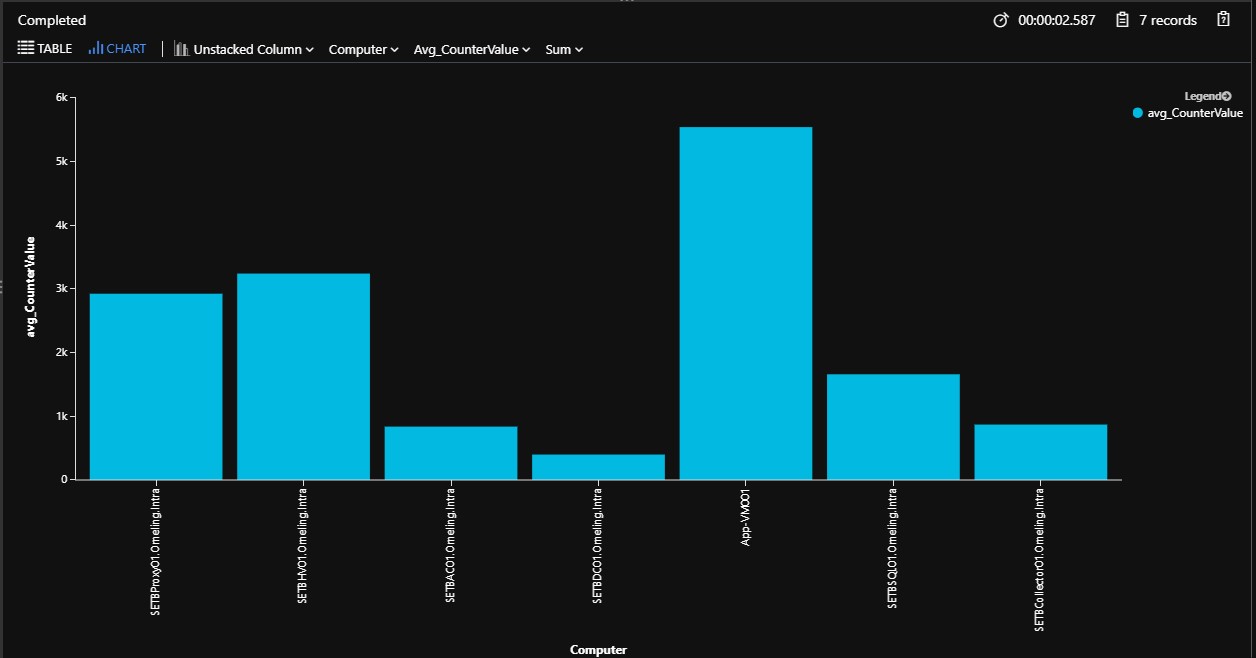
A graph showing the average value of available memory of a collection of servers
Summary
As you have seen in this post, there´s quite a large number of ways to get your data into Azure Monitor to make it searchable and also make it possible to generate alert rules from. If that´s something you want to do, you can read more about that here.
Thanks to its rich capabilities of importing data from both applications, servers and other sources makes it a real competent monitoring solution. It doesn’t have to be used solely for monitoring as one would think based on just the name, but it´s a great log collection service as well making all the data it imports searchable. There are lots of stuff to write about when it comes to Azure Monitor, which will of course be covered in later blog posts.
Keep your eyes open for more blog posts and if you have any questions, just leave a comment below and I´ll get back to you.
Comments