Creating dynamic Distributed Applications in SCOM
For the past two years or so I have been talking a lot about how to monitor business services, and most of the time I have done this with Savision Live Maps as a great solution for this. But what about those that haven´t invested in Live Maps? Are they left out of this great way of monitoring? The short answer to this question is no.
When using Live Maps to monitor the services we´re using Distributed Applications which is a big part of SCOM and has been for a long time now. This approach that I will show in this post is focusing on how to create dynamic distributed applications solely based on groups and their content. Once you´ve added a group into a DA, it disappears from the console and it seems there is no way of updating it or even seeing it again. However, this is easy to go past and to be able to use it and update it again.
Preparations
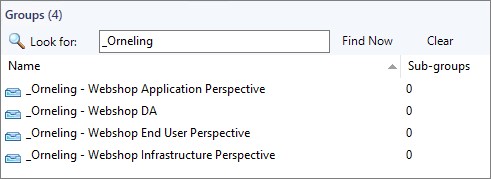
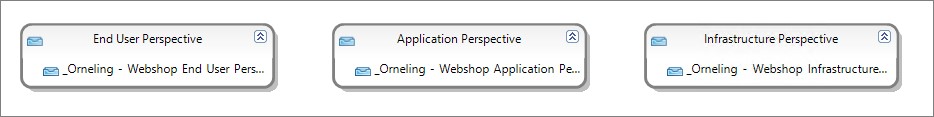
For this first step, I have created four groups that I will use for my DA. I´m still using the concept of three tiers;
- End User
- Application
- Infrastructure
All groups except for the “_Orneling – Webshop DA” has been updated with some content such as DB´s, servers etc. to be displayed in the DA.
Creating the Distributed Application
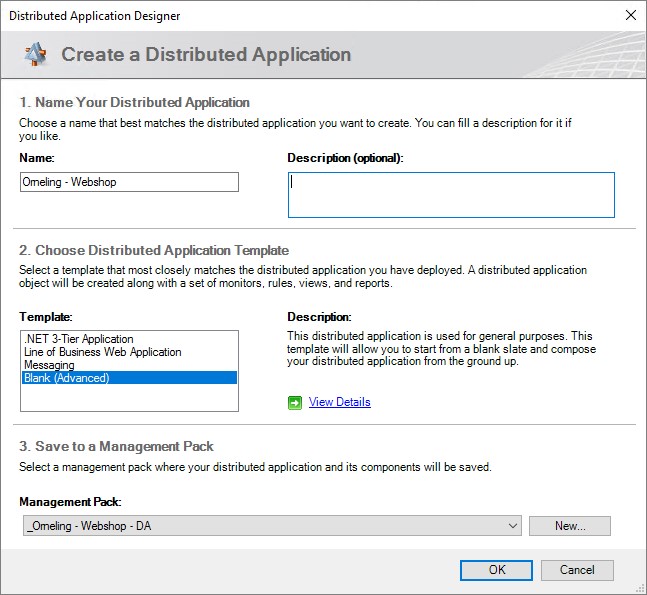
Now, create a new DA (under the Authoring tab in the console), give it a name and point out a MP where you want to store it. For this example, I´m storing all groups, monitors and other stuff in the same unsealed MP.
Okay, now let´s add some components to our DA. Instead of adding single DB´s, servers and so on, I simply add my three groups as you can see below.
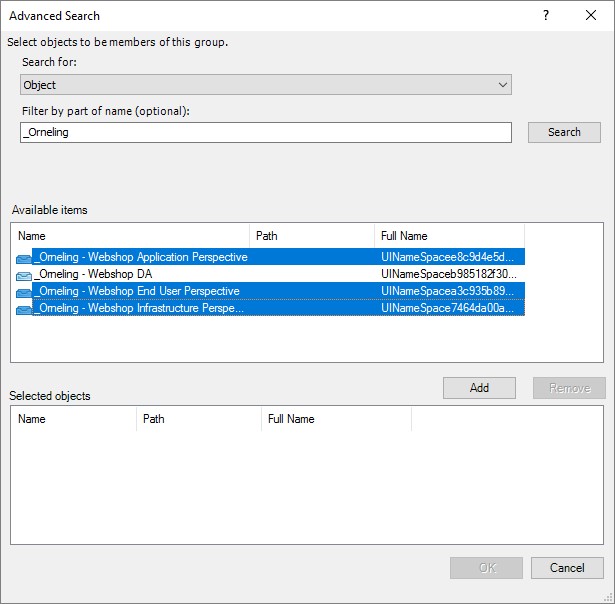
Move your three groups on to the field and give the components a name, just like I´ve done below. Save the DA and close the editor.
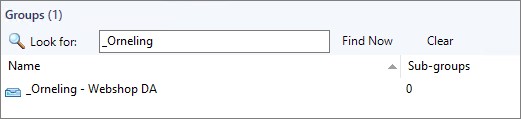
So, let´s see how my groups are behaving. Just as expected, my three groups are gone and are nowhere to be found. So how do we solve this problem?
Simple, right click the remaining group and choose properties.
Step over to the ”Subgroups” tab and there, add your three groups as subgroups.
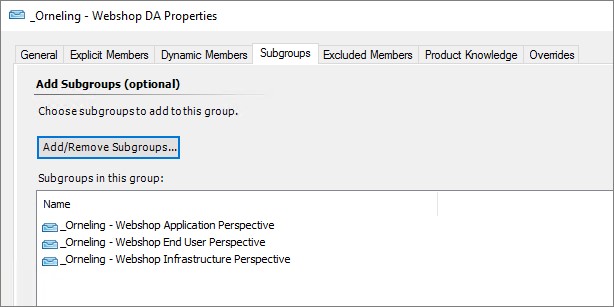
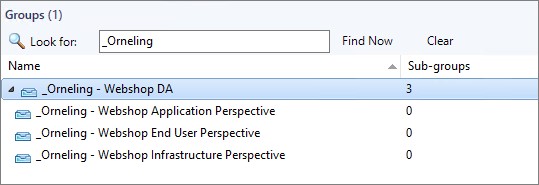
Once the subgroups are covered, you will be able to see your groups again in the console. Now you can update your groups however you like and add new components. And since these are regular SCOM groups you can use either static rules or you can use the dynamic rules to populate your groups, and by that control what shows up in the DA.
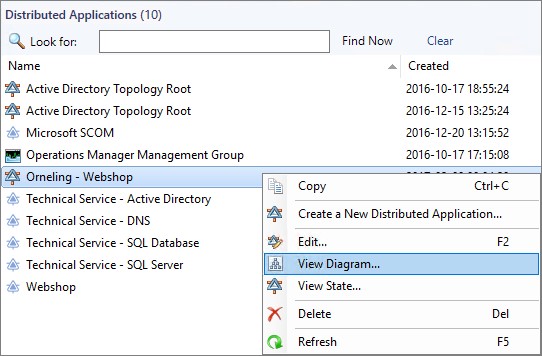
Now that the groups are covered and we´ve created the DA, let´s check it out. Right click your DA and choose “View Diagram…”.
Controlling the rollup behaviour
Now that´s nice, we can see all the included components and their health. But since we´re using groups in this DA, the health of the objects won´t roll up as we want it to by default.
However, thanks to Tao Yang, this is easy to solve. For this method, I´m using his (really great) Self Maintenance MP that I´ve imported into my environment and which covers a lot of things like;
- Additional Performance Rules for Data Warehouse DB Staging Tables row count.
- Additional 2-State performance monitors for Data Warehouse DB Staging Tables row count.
- Additional Monitor: Check if all management servers are on the same patch level
- Additional discovery to replace the built-in “Discovers the list of patches installed on Agents” discovery for health service. This additional discovery also discovers the patch list for OpsMgr management servers, gateway servers and SCSM servers.
- Additional Agent Task: Display patch list (patches for management servers, gateway servers, agents and web console servers).
- Additional Agent Task: Configure Group Health Rollup
- Updated “OpsMgr 2012 Self Maintenance Detect Manually Closed Monitor Alerts Rule” to include an option to reset any manually closed monitor upon detection.
- Additional Rule: “OpsMgr 2012 Self Maintenance Audit Agent Tasks Result Event Collection Rule”
- Additional Management Pack: “OpsMgr Self Maintenance OMS Add-On Management Pack”
For this post I will be using the highlighted feature, “Additional Agent Task: Configure Group Health Rollup” to create the rollup monitors needed for this DA. Close the Diagram view and head back to the group view.
Note: So far this method using the Self Maintenance MP only works in SCOM 2012 and not in SCOM 2016. I will dig into it and try to find out what´s causing the issue when runing the task in SCOM 2016 and update the post.
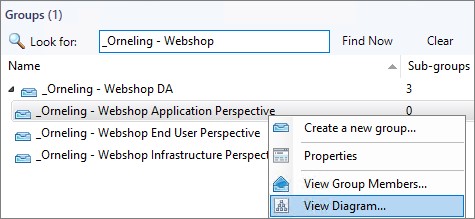
Open the diagram view of the first group as seen below.
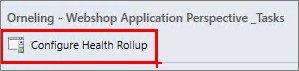
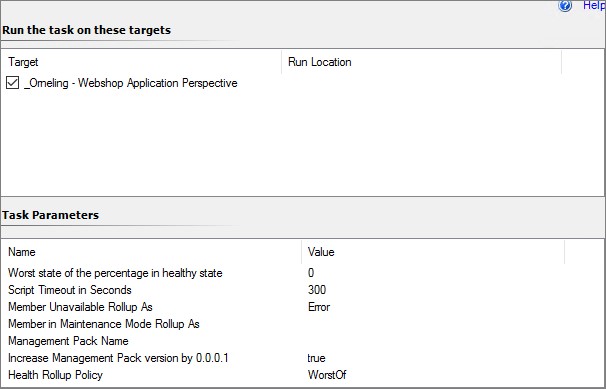
Now that your inside the diagram view, highlight the group at the top of the diagram and then click the ”Configure Health Rollup” task to the right.
What we are about to do is to create a rollup monitor, which will control the way our healthy or unhealthy components roll up to affect the DA´s health. For this example I´m using the standard values, this is because I want the worst component of the group to affect the top level of the service. Make your choice and go through with it. This shouldn´t take long but be patient.
After the monitor is saved, repeat this process for the two remaining groups (End User and Infrastructure).
Note: Do not fire off more than one of this task at a time. Wait for it to finish before starting the next one.
Checking out the result
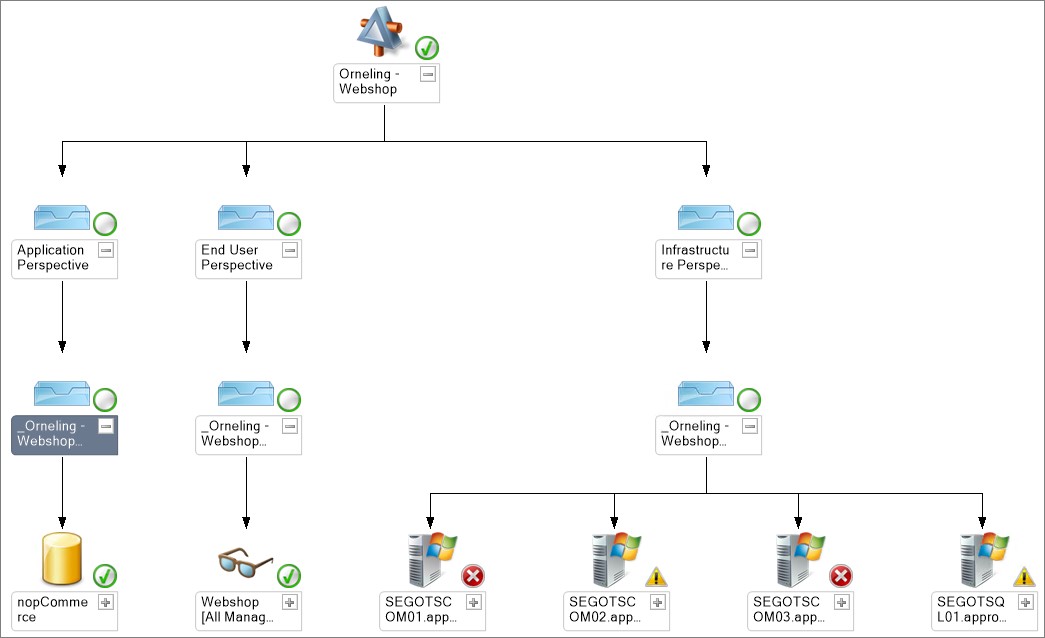
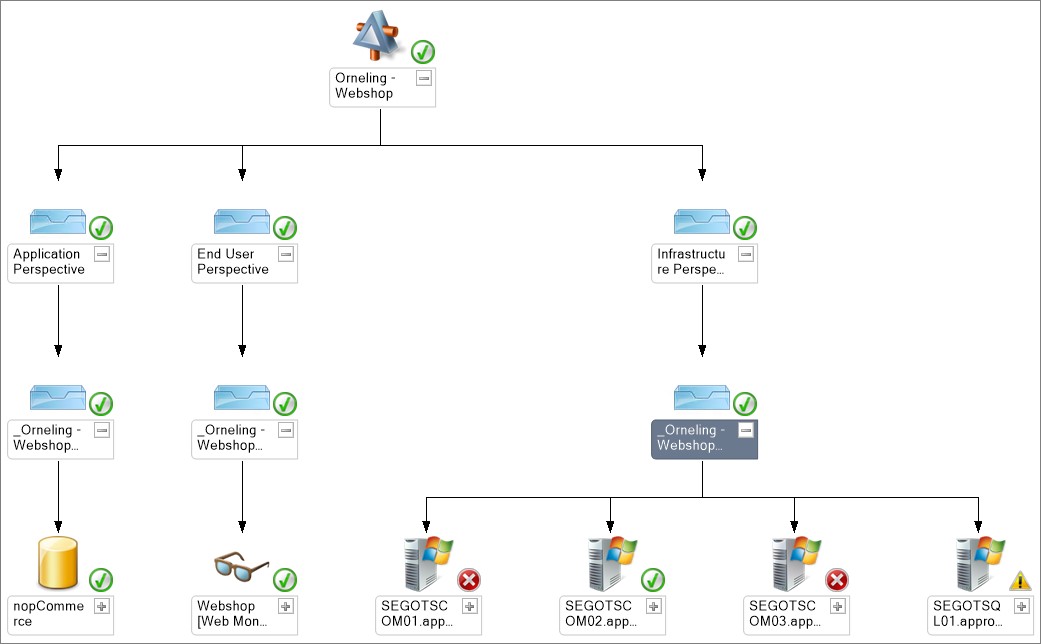
Now that all the monitors are created we can see that the groups have rolled up their health and we can now start using the DA. You might think that the below picture is really odd with a healthy state but the components show up as critical. This is actually as expected, and the reason for that is because of what´s inside the group.
In the infrastructure group I have added three servers using the class “Windows Computer”. The faulty components on these servers are of a different class (Health Service) and therefore doesn’t affect the state of the Windows Computer object. To create a real error in this DA, I created a new service monitor looking at the print spooler targeting Windows Computer. Once I stopped the Print Spooler service on one of the servers, this rolled up and affected the state of the DA.
Summary
What you´ve seen here is an easy and in my opinion, a very good way of creating DA´s with just the native SCOM components. It´s really easy to get going but if you are looking at Savision Live Maps, you need to know that it will be even easier to set your services up and to create different SLA´s etc. If you were to move on with Live Maps, the services that you had created with this method could be imported into Live Maps using their “Authoring Console”.
I hope you like what you´ve seen and that it helps you in setting up your business services as this can be a pretty time consuming process to get to know. If you have any comments or questions about what I´ve done, leave a comment below and I´ll get back as soon as possible.
Comments