Create your own solutions in OMS
My last big blog post about monitoring Nano server is dated May 17th which makes it approximately 6 weeks since then. Out of that 6 weeks, 3 weeks have been vacation but now it’s time to get this blog going again.
So what are we talking about today? The long-awaited for possibility to create your own solutions in OMS have arrived! It´s still in preview and I saw it a couple of days ago for the first time so this is where I will show you how to get started with the “View Designer”.
Activating the feature
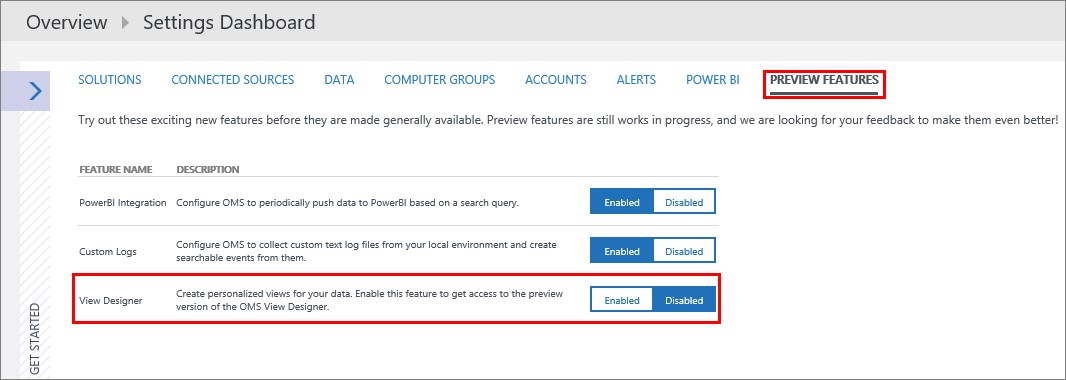
As I mentioned, it´s still in preview which means we need to activate it. That´s done by going into Settings and then heading over to “Preview Features” to the far right. Switch the “View Designer” to Enabled and accept, and you´re good to go.
Designing your first solution
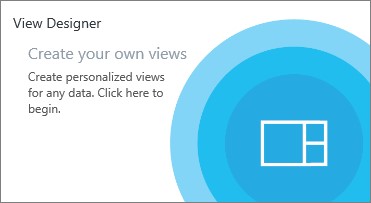
Now that you´ve activated the view designer you can find it on the first page as a tile among the other solutions.
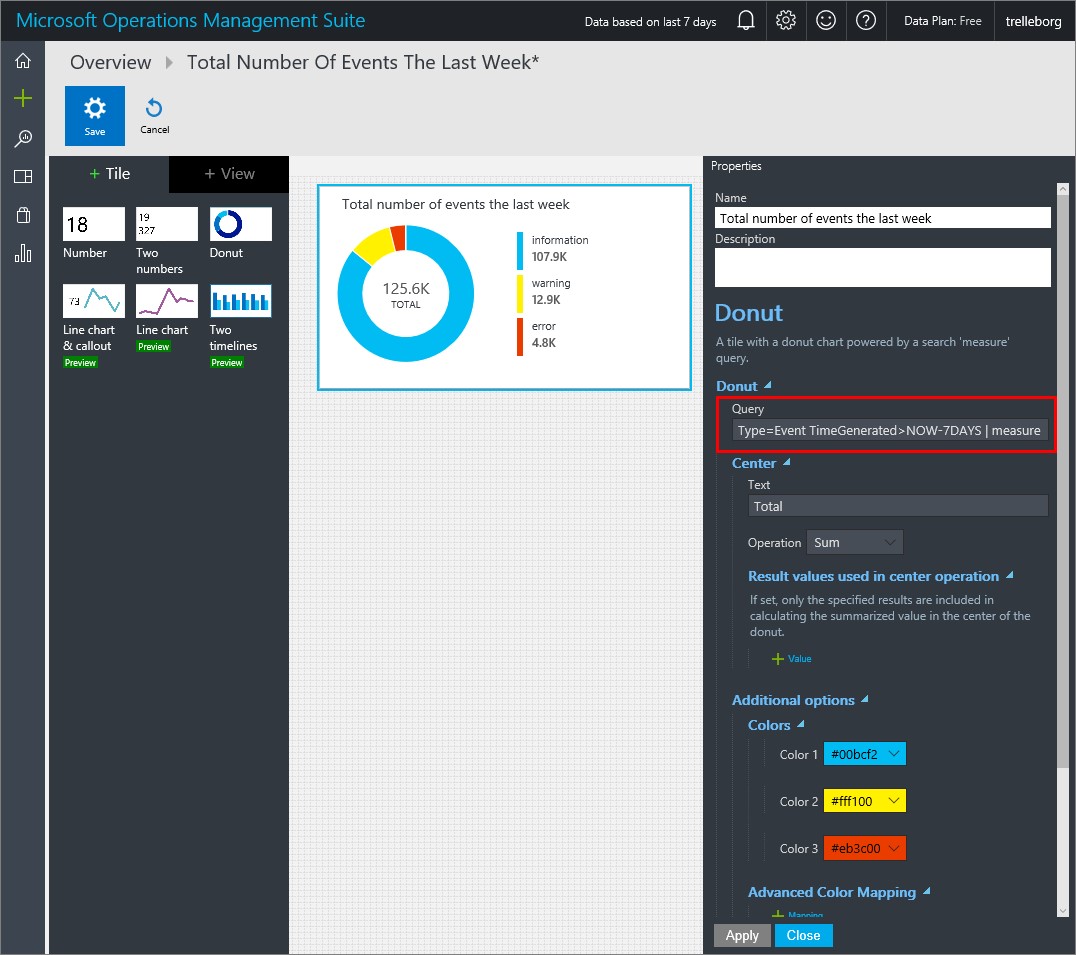
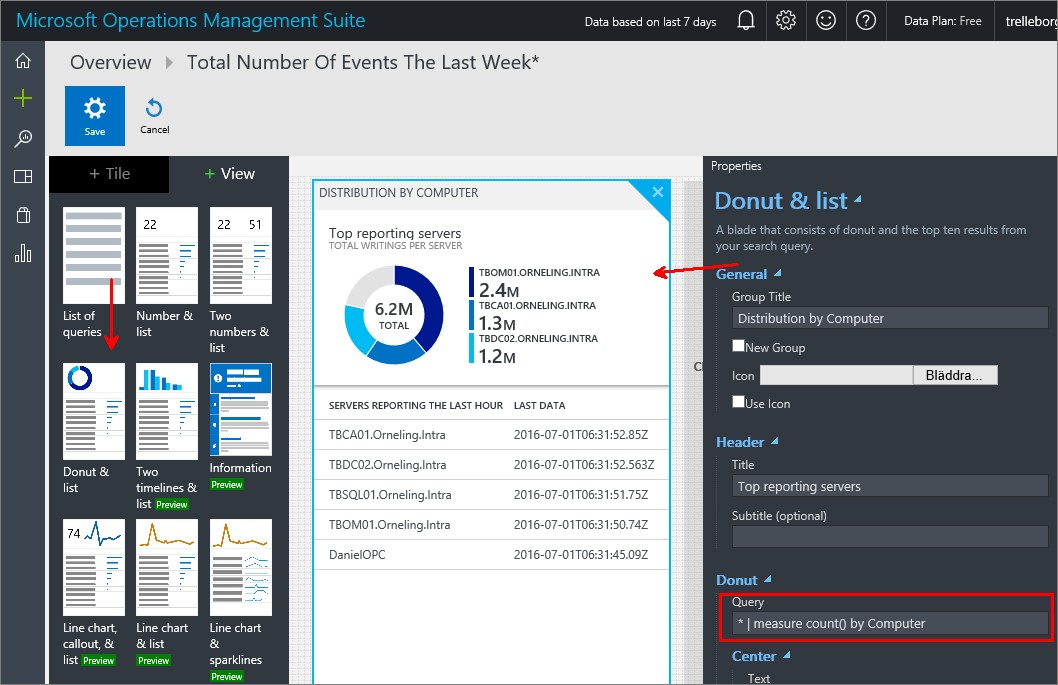
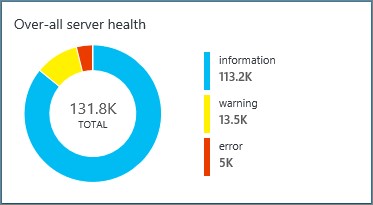
I´m going to start with the tile that will be my first experience with the solution I´m going to build. This will be the way to get into the solution and to find out how the environment is doing. What I´ve used here is the “Donut” tile and I have made the changes seen to the right. The query I´m using is Type=Event TimeGenerated>NOW-7DAYS | measure count() by EventLevelName. If you don´t see your changes immediately, click Apply at the bottom and you will see them. Here I have also changed the colors for information, warning and error to better match the status of the event level.
So, over to the views and what we will show as a part of the solution. The first view is the “Donut & list” for which I´ve made the below changes. In the donut I´m showing which three servers are reporting the most to OMS. In this case my SCOM server is the one reporting the most. This isn´t based on Events or Performance or anything specific, this query measures everything that´s sent to OMS.
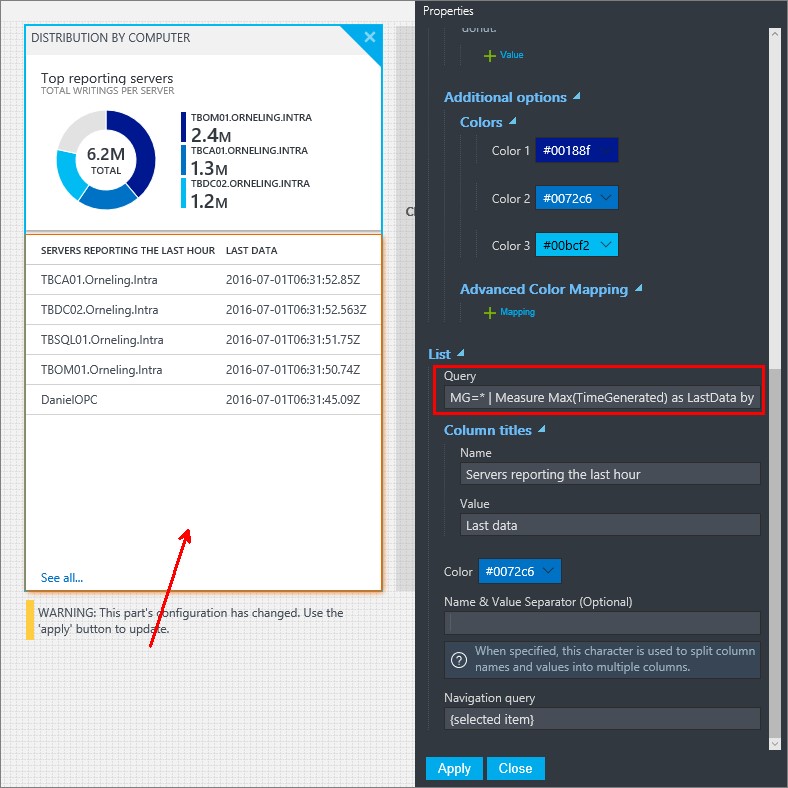
For the list I want to show the servers that have reported to OMS the last hour. To show this I have used the query MG=* | Measure Max(TimeGenerated) as LastData by Computer | where LastData>NOW-1HOURS | Select Computer,LastData. A pretty simple query but it does the job. You can also change what you want to say over the results, I´ve changed the default into “Servers reporting the last hour”.
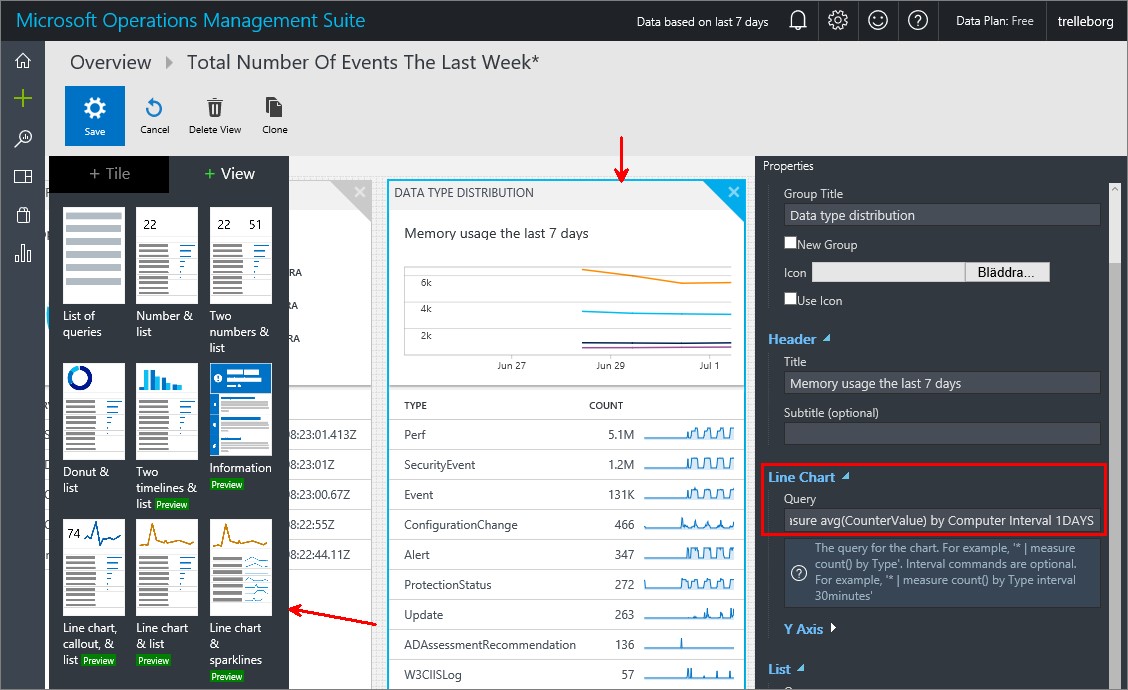
The last view I´ll add to my solution today is a “Line chart & sparklines” where I will show off some memory stats in my environment. For the first line chart, I´ll be showing the number of available megabytes. The query I used is Type:Perf (ObjectName=Memory AND CounterName=”Available MBytes”) | measure avg(CounterValue) by Computer Interval 1DAYS and will give the result you can see below.
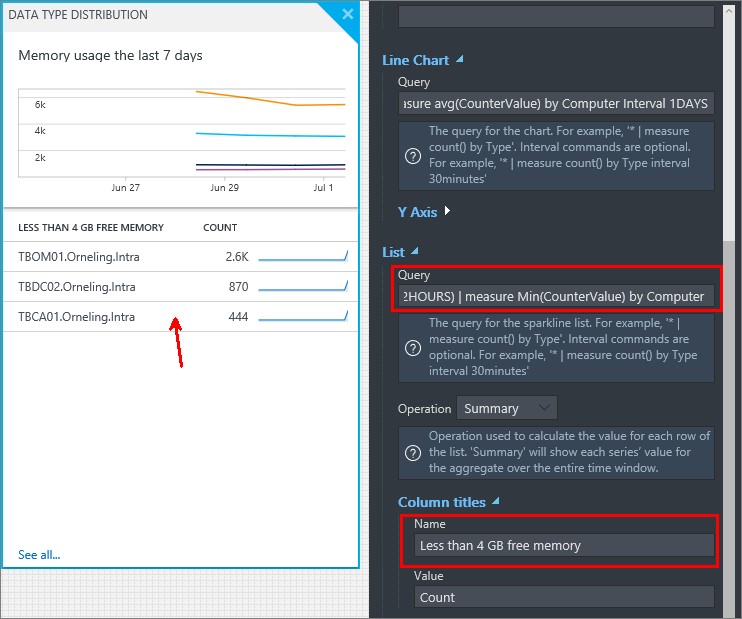
So for my last list for today I´m going to display servers with less than 4 GB of available free memory. To display this, I used the query Type=Perf (ObjectName:Memory AND CounterName:”Available MBytes” AND CounterValue<4096 AND TimeGenerated>NOW-2HOURS) | measure Min(CounterValue) by Compute which then shows the servers that have reported having less than 4 GB of free memory during the last two hours.
Now that I´m done with the solution for now, I´ll just click Save at the top and move back to the main screen of the OMS portal. 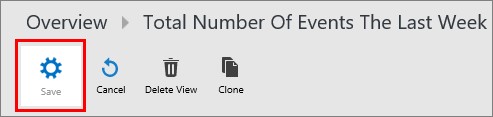
There it is, our new “home-made” solution. Click on it and you´ll get to see the under-lying views you just created. 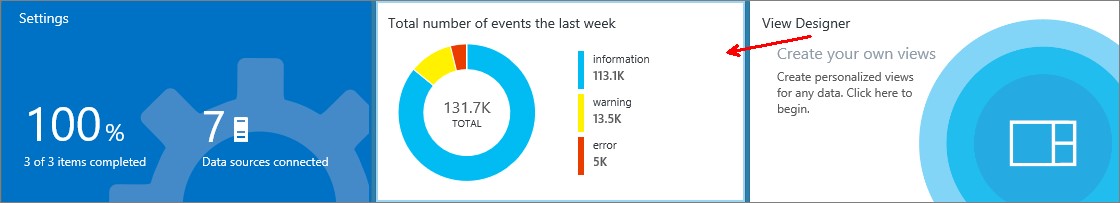
Just as we saw in the editor, this is what you get with our new solution. This makes it really easy to show directly on a wall-mounted screen the status of the environment. 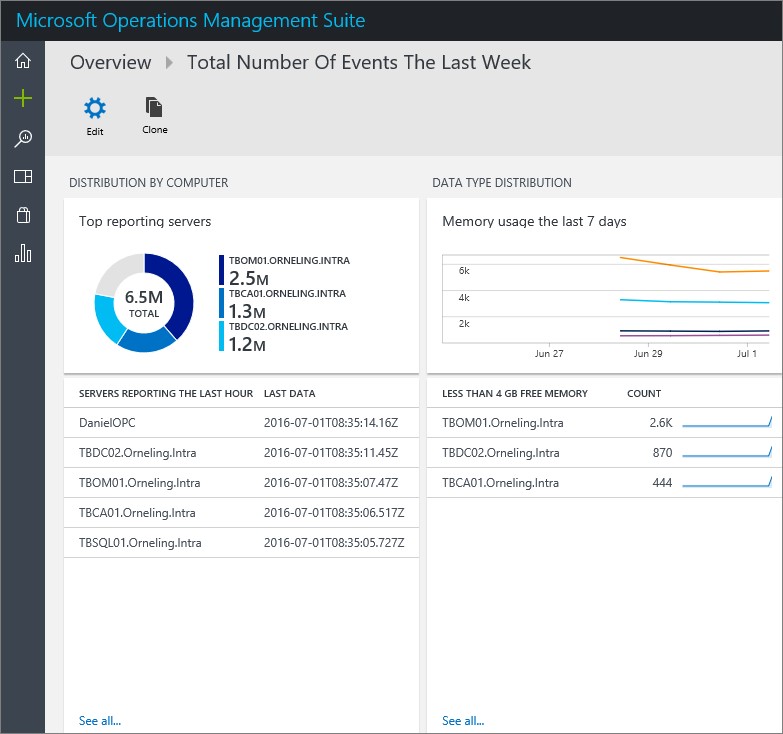
Okay, it looks real nice and all but I´m not happy with what I named it. How to change? Click Edit for starters. 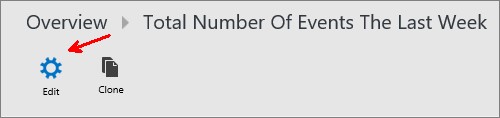
Click ”Tile” as below and then rename the tile as I´ve done to the right followed by Save and you´re done. If you for some reason want to delete the solution, you can now do that from this same menu. The delete option wasn´t there when I first tried it out so it´s showed up during the night or so which is very welcome. 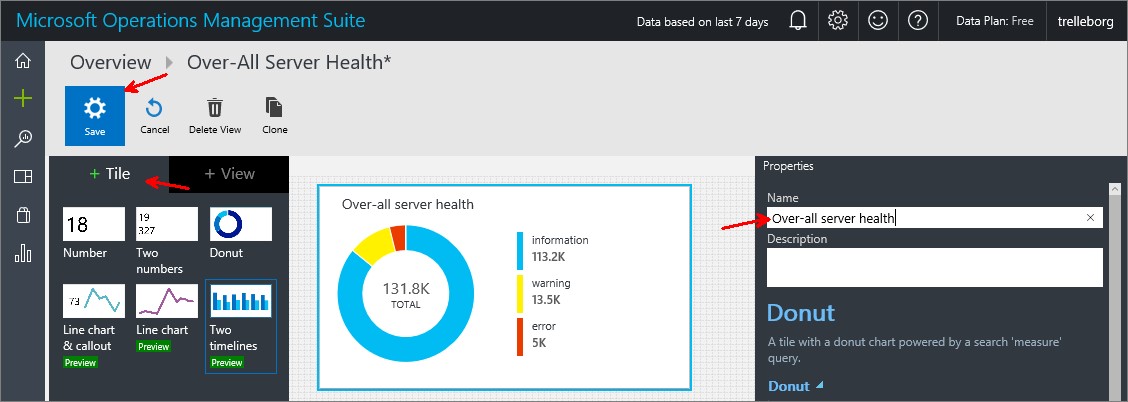
Now it looks a lot better on my OMS main screen.
Summary So now you´ve seen some of what you can do with the view designer and as you can see it´s not really that hard to get started with it. Just remember that when you create your solutions you will need all the queries you will use, at this stage you can´t call for your saved queries from inside the designer. I´m pretty sure that will show up soon enough so stay tuned and carry on with your solution creating.
If you want to read more about the view designer, a couple of other bloggers have written their own reviews as well:
- Cameron Fuller writes about the view designer at http://blogs.catapultsystems.com/cfuller/archive/2016/06/29/using-the-new-view-designer-in-microsoft-oms/
- Shawn Tierney has made a really good post at https://scomanswers.com/2016/06/29/create-your-own-solution-with-oms/
That´s all for today folks, if you have any questions just drop them in the comments below.
Comments