Visualizing OMS data in Power BI
If you just like me have been using OMS now for a while and collected a serious amount of data, collecting everything from a ton of events to the update status of my servers, you might now have a lot of information to work with. You can always use the search syntax in OMS to check out on your data in a nice way and it´s very simple. But what if you want to create reports out of the data? It´s possible to export data from OMS to watch in Excel for example, but what if you want to do some fancier reports using the data? Visualizing OMS data in Power BI is your answer and will help you create those fancy reports that you´ve been dreaming about! A while back I wrote a blog post for the OMS team blog where I went deep on how to integrate OMS with Power BI and to export data from OMS to Power BI. If you haven´t read that post yet, you really should. Not only because it´s really nice to see how easy it is to get started, but also because I won´t show the integration part in this post. Instead, I will just show you some examples of what you can do with the information that you sent from OMS to Power BI in a couple of reports. You can find the blog post here on the OMS team blog. So now that you´ve read the post and have set up the integration, you may want to create some fancier reports than I did in the examples of the blog post for the OMS team. Below I will go through what I´ve done to create a report and I will also show two additional reports as well.
Creating a report showing Security Event data Okay, so now that I have created the dataset shipping security events to Power BI, I need to create a report of it. For the first diagram which is marked below, I have used the fields to the right (Account and Computer) to show the data I want. To achieve what I´ve done below I have used the “Pie chart” that you can see under visualizations.
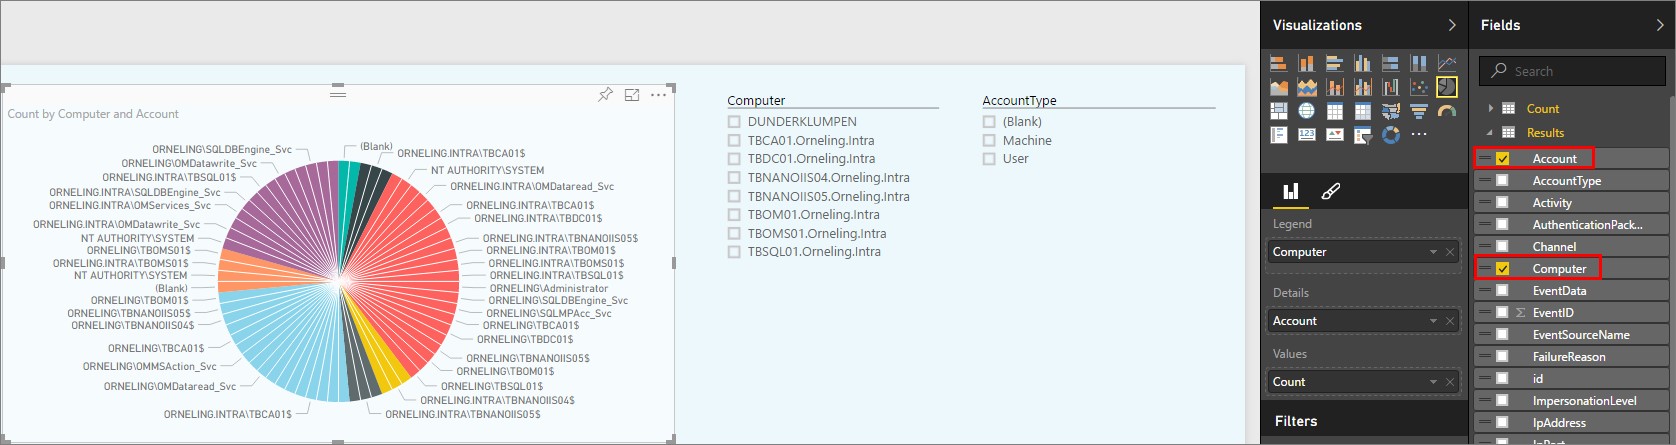
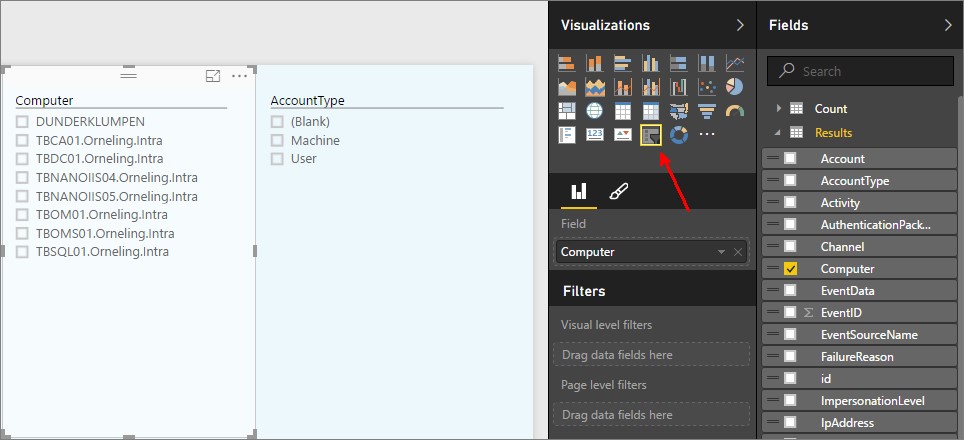
The two below parts are just markers where you can select which computer or accounttype you want to show. For these two, I´ve used the slizer and as you can see I have used the fields “Computer” and AccountType”.
The last piece of the puzzle is the part where you can find more information on exactly what has happened and you can in a very easy way find out more information on a specific server. For this part I have used the fields “Computer, Account. AccountType, Activity and Process”.
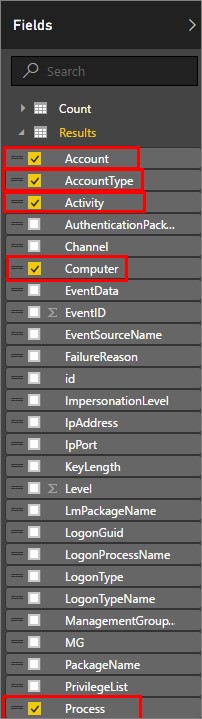
See below for what it looks like when the last piece of the puzzle is finished.
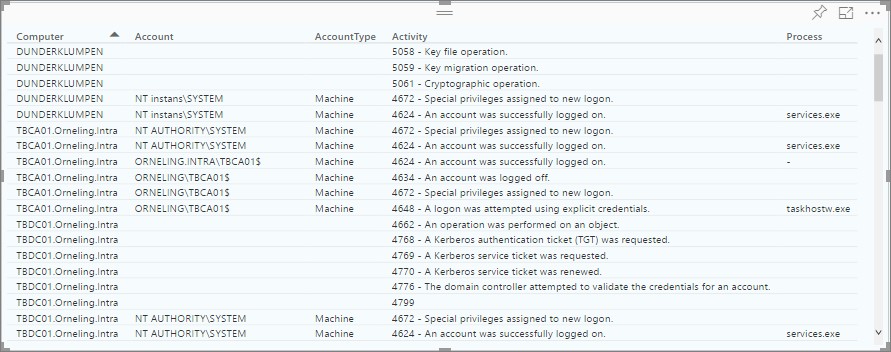
Now, let´s check out the final result. As you can see here I have chosen TBOM01 as the server and User as the account type and you will see a lot of information regarding that server and the account type. If you want to know more about a slice, just hover over it with your mouse.

A couple of other examples The first example I want to show is the report where I´ve put together information about the patch status of my environment. As you can see below, you will be able to drill down by selecting a single server and update state. With this report it´s really easy to find out what you have installed or need to install in your environment.

Check out my SQL server below to see what it looks like when I check out just that server. Notice the “Count of Product by Classification” chart where you will see what kinds of patches are missing or already installed.

The installed patches are categorized as below and hopefully I won´t see much when I switch to show “Needed” instead.

Just as expected, the patches that are needed are classified as Definition Updates.

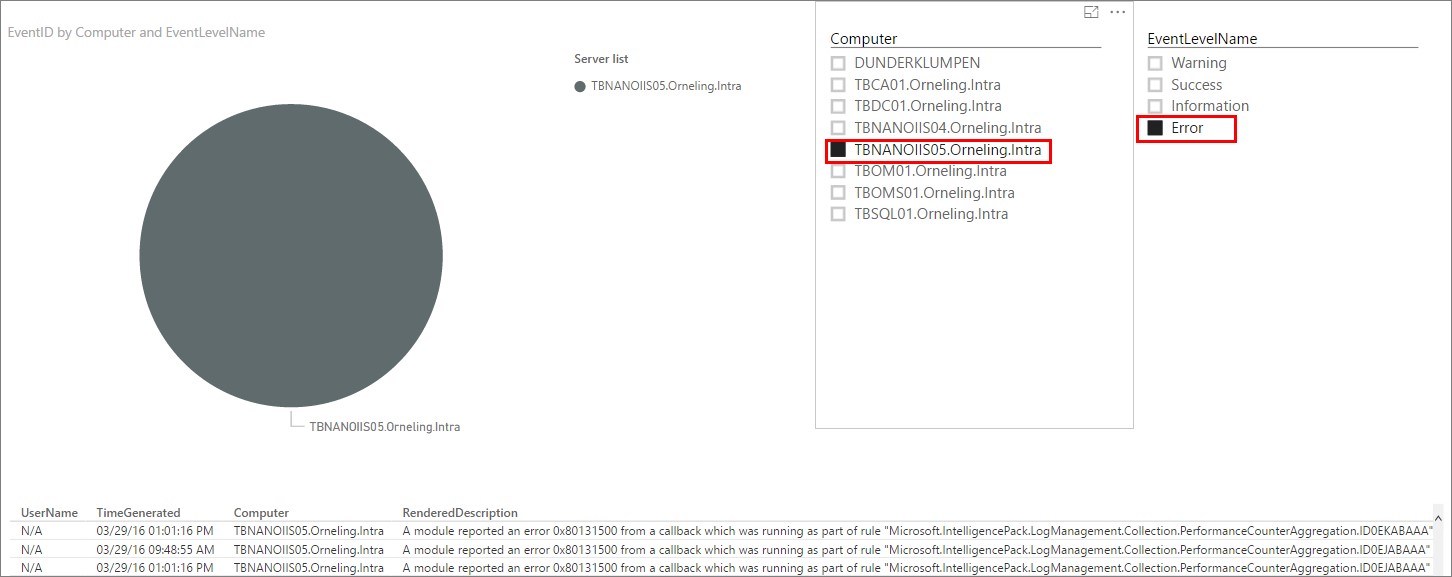
The last example I want to show you is the report where I can pick up information on events on my servers. For this example, I have pointed out one of my Nano servers which are connected to OMS through SCOM and is shipping their event log information that way. As you can see below, the intelligence packs aren´t really friends with the Nano server yet. Will we see more of this in the future? I definitely think so .
Summary Now you have seen a little more of what you can do once you have connected OMS and Power BI and as you can see, you can do pretty much. The only limit is your ideas and if you have the data in OMS, you can create really good-looking reports out of it. So now that you have this possibility (Still in Preview though), what is your next step? Leave your comments and questions below and I´ll get back to you.
Comments