Creating custom fields in OMS
Operations Management Suite (OMS) is great in gathering data about your environment and letting you dig into the data gathered to find intrusions for example. But what about if you see a recurring event in your event logs that you want to dig deeper into? Yesterday, Microsoft revealed the feature (still in preview) to create your own custom fields in OMS based on information found in your searches. In the example below (I´m using the same example as Microsoft did in their blog post as I think it´s a real good example. Basically what it does is that it allows you to pick out specific services which has started or stopped and how many times they have done so in a given time frame. Finding the information
The first thing to do is to create a search that reveals the information you want to pick up. The search I´m using below picks up all events with the ID of 7036 from the System log on my servers. With the information it provides, I can then use it to create my own custom field.
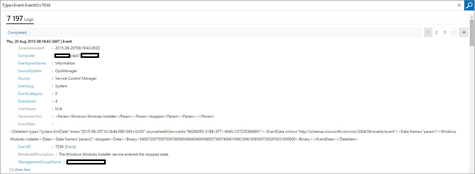
To create the field, click the “three striped button” to the left of the field “Rendered Description” and click “Extract fields from ‘Event’ (Preview)”.

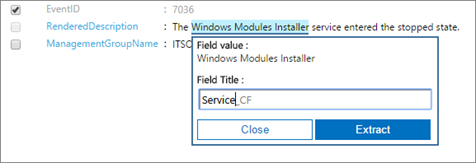
To define your Field value, mark the service name which in this case is “Windows Modules Installer” and then name the field. In this case I´m going to call it “Service_CF” where _CF is placed there by default. Click Extract to move on and then click “Save Extraction”.
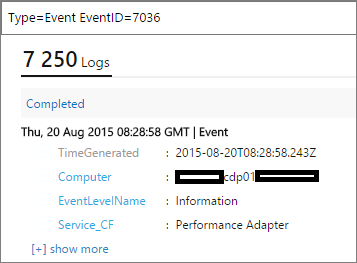
The next thing is to run the same search as you did above but with a difference. This time you will see the field “Service_CF” as well. This field will however just show up on new entries so you will have to wait for some time for the new field to show up. As you can see in the picture below the new field shows up when running the same search once again.
| Of course you want to be able to see how many times a service has restarted in your environment. The below search (Type=Event | measure count() by Service_CF) were made just a few minutes after I created the field and as you can see “Modules Installer” had restarted twice at the moment when I took this screen shot. |

The below screen shot were taken about an hour later and now there are three services showing up and “Windows Update” have joined the party as well.

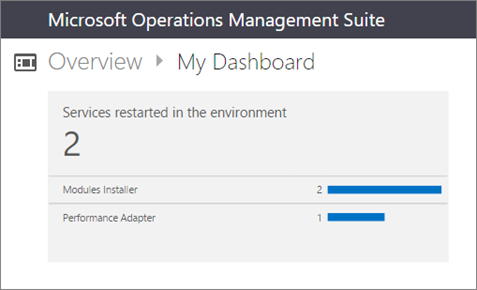
A great way to show what it looks like in your environment is to place the saved search (you can choose to save the search in the log search session) on you own dashboard. This dashboard will only show what you yourself has chosen to display on this dashboard. This makes it easy for you to gather the information you care about and not needing to look out for other´s needs.
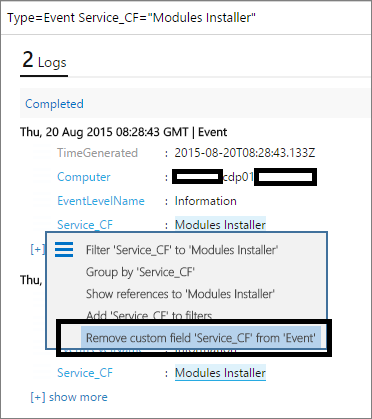
If you for some reason want to remove the field you created, run a search like the one below for example and click the “three striped button” to the left of your field. Choose “Remove custom field” and start over with another field instead.
Summary
With this feature, Microsoft have made it even easier to collect the information you need and given you the opportunity to create fields to help you get even better information out of the system. Note that in order for this example to work, you need to have Information level events gathered by OMS as well. Only gathering Error and Warning classed events won´t be enough since the event ID 7036 is an informational event.
As always, if you have any questions just leave a comment below.
Comments